|
The
Elasticity and Buoyancy of the Botswana Tax System and their Determinants -
Thuto D Botlhole
Lecturer,
Department of Economics,
University of Botswana,
Gaborone, Botswana.
E-mail: botlholetd@mopipi.bw
- Tamunopriye J Agiobenebo
Professor,
Department of Economics,
University of Port Harcourt,
Choba,
Rivers State, Nigeria.
E-mail: tjagiobenebo@yahoo.com This
study extends the theoretical, methodological and empirical developments in tax
elasticity and buoyancy estimation in several ways. First, rather than assuming
that the tax base is exogenous, it considers the very strong theoretical possibility
that it may be endogenously determined by several factors such as structural shifts
in the domestic economy; developments in the external economy; trends in regional
cooperation and integration; and tax effort and evasion. Using the Botswana tax
system as a case study, it shows that these factors are important determinants
of the tax base, and hence, tax elasticity and buoyancy. Utilizing a Vector Error
Correction Model (VECM), it reveals that the Botswana tax system is income-elastic
and buoyant; trends in regional cooperation and integration are exerting negative
influence on tax revenue via its depleting impact on Southern African Customs
Union (SACU) revenue; tax evasion is revenue-depleting, and hence, dampens the
elasticity and buoyancy of the tax system; openness of the economy has significant
influence on tax revenue yield, thus, trade liberalization and globalization have
serious implications for tax system elasticity and buoyancy; and economic diversification
resulting in dynamic structural shifts have positive effects on both the tax base
and revenue yield. It emphasizes that mineral tax revenue is buoyant and elastic
with respect to mining GDP; non-mineral income tax is buoyant and elastic with
respect to exports; customs and excise duties are neither buoyant nor elastic
with respect to imports and regional integration; and also that government tax
effort is only about 27%, a degree far below its potential. These findings carry
important policy implications. Background
At
independence in 1966, Botswana was so poor that it could not even meet its recurrent
budget needs. Consequently, both its recurrent and development budgets depended
heavily on foreign aid. But, the discovery of diamonds in 1967 and exploitation
along with copper nickel beginning in the early 1970s combined with prudent use
of the mineral rents; good economic management and accountable democratic governance
changed the equation for good such that by the mid-1990s Botswana has been designated
as a middle country by the Work Bank. However, the good fortune of the country
has also meant an elimination by substitution in the sense that foreign aid has
declined over time on account of its status as a Middle Income Country (MIC).
The implication of this is that increasingly, Botswana must depend on domestic
resources and/or loans to finance the continued growth and development of its
economy and society. Debt financed development will be at an interest cost, that
means rising cost of development with the possibility of debt trap along the way.
It follows that the most viable source of development in finance is the effective
and efficient mobilization of domestic resources. Given
this reality and the dwindling level of aid as clearly expressed in Table 1, it
is compelling that the potentials and robustness of the resource mobilization
system of Botswana, in particular, the principal mechanism of the tax system,
can be mapped and appropriately measured. In 1983, development grant accounted
for over 34% of development expenditure; it has declined albeit with fluctuations
to only 2.2% in 2002, and whereas total grants accounted for about 25.5% of total
government expenditure in the same year, it has dropped to only 2.2% in 2002.
Similarly, development grant, which was 4.9% in 1981 has declined to as low as
0.5% in 2002 albeit with oscillations. The same pattern is shown by the proportion
of total grants in Gross Domestic Product (GDP), which was 5.1% in 1981 but has
fallen to just about 0.5% in 2002. Clearly, therefore, the tax system as the major
source of government revenue must be understood in terms of key properties such
as productivity, responsiveness, buoyancy and robustness to shocks and their determinants
to facilitate informed management of the system to enable it serve its purposes
effectively and efficiently.
Table
1: Historical Behavior of GDP,
Aid and Government Expenditure in Botswana,
1981-2002* | Years | GDP | DG | TG | DE
| 1981 | 780.1 | 38.2 | 39.7 | 129.3 |
1982 | 1,029.0 | 44.6 | 47.2 | 160.4 |
1983 | 1,278.9 | 48.2 | 48.2 | 140.7 |
1984 | 1,523.5 | 34.2 | 39.5 | 209.7 |
1985 | 2,144.9 | 39.7 | 41.1 | 247.5 |
1986 | 2,809.8 | 65.8 | 67.6 | 407.4 |
1987 | 3,795.6 | 104.3 | 105.9 | 558.2 |
1988 | 5,472.0 | 108.7 | 109.7 | 797.3 |
1989 | 6,130.1 | 39.3 | 40.1 | 827.7 |
1990 | 6,995.0 | 114.1 | 117.8 | 1,090.1 |
1991 | 7,810.1 | 68.7 | 69.9 | 1,098.0 |
1992 | 9,542.6 | 98.3 | 100.1 | 1,207.0 |
1993 | 11,041.4 | 185.4 | 186.6 | 1,558.3 |
1994 | 12,261.8 | 35.3 | 75.6 | 1,377.8 |
1995 | 14,203.9 | 32.0 | 37.1 | 1,672.0 |
1996 | 17,740.3 | 74.7 | 83.0 | 2,239.6 |
1997 | 20,162.6 | 110.5 | 112.1 | 2,695.5 |
1998 | 21,523.9 | 136.4 | 137.7 | 2,934.5 |
1999 | 24,943.1 | 126.0 | 126.0 | 3,451.0 |
2000 | 34,787.2 | 64.5 | 64.5 | 3,134.6 |
2001 | 35,693.4 | 139.5 | 139.5 | 8,482.0 |
2002 | 38,688.3 | 199.1 | 200.9 | 9,098.0 |
Total | - | 1907.4 | 1,989.8 | - |
Ave | - | 86.7 | 90.4 | - |
*
All absolute values are in million Pula. | Key:
GDP = gross domestic product; DG = development grant; TG = total grant; DE = development
capital) expenditure; TE = total government expenditure |
Source:
Bank of Botswana (various issues) Annual Report and Computations by Authors. |
Table
1: Historical Behavior of GDP,
Aid and Government Expenditure in Botswana,
1981-2002* |
Years |
GDP |
TE |
DG/GDP
(%) |
DG/DE
(%) |
TG/GDP
(%) |
TG/TE
(%) |
1981 |
780.1 |
168.9 |
4.9 |
29.6 |
5.1 |
23.5 |
1982 |
1,029.00 |
207.6 |
4.3 |
27.8 |
4.6 |
22.7 |
1983 |
1,278.90 |
188.9 |
3.8 |
34.2 |
3.8 |
25.5 |
1984 |
1,523.50 |
249.2 |
2.2 |
16.3 |
2.6 |
15.9 |
1985 |
2,144.90 |
288.6 |
1.9 |
16.1 |
1.9 |
14.2 |
1986 |
2,809.80 |
475.0 |
2.3 |
16.1 |
2.4 |
14.2 |
1987 |
3,795.60 |
664.1 |
2.7 |
18.7 |
2.8 |
16.0 |
1988 |
5,472.00 |
907.0 |
2.0 |
13.6 |
2.0 |
12.1 |
1989 |
6,130.10 |
867.8 |
0.6 |
4.7 |
0.7 |
4.6 |
1990 |
6,995.00 |
1,207.9 |
1.6 |
10.5 |
1.7 |
9.8 |
1991 |
7,810.10 |
1,167.9 |
0.9 |
6.3 |
0.9 |
6.0 |
1992 |
9,542.60 |
1,307.1 |
1.0 |
8.1 |
1.0 |
7.7 |
1993 |
11,041.40 |
1,744.9 |
1.7 |
11.9 |
1.7 |
10.7 |
1994 |
12,261.80 |
1,453.4 |
0.3 |
2.6 |
0.6 |
5.2 |
1995 |
14,203.90 |
1,709.1 |
0.2 |
1.9 |
0.3 |
2.2 |
1996 |
17,740.30 |
2,322.6 |
0.4 |
3.3 |
0.5 |
3.6 |
1997 |
20,162.60 |
2,807.6 |
0.5 |
4.1 |
0.6 |
4.0 |
1998 |
21,523.90 |
3,072.2 |
0.6 |
4.6 |
0.6 |
4.5 |
1999 |
24,943.10 |
3,577.0 |
0.5 |
3.7 |
0.5 |
3.5 |
2000 |
34,787.20 |
3,199.1 |
0.2 |
2.1 |
0.2 |
2.0 |
2001 |
35,693.40 |
8,621.5 |
0.4 |
1.6 |
0.4 |
1.6 |
2002 |
38,688.30 |
9,298.9 |
0.5 |
2.2 |
0.5 |
2.2 |
Total |
- |
- |
33.7 |
240 |
35.3 |
211.6 |
Ave |
- |
- |
1.5 |
10.9 |
1.6 |
9.6 |
*
All absolute values are in million Pula. |
Key:
GDP = gross domestic product; DG = development grant; TG = total grant; DE = development
capital) expenditure; TE = total government expenditure |
Source:
Bank of Botswana (various issues) Annual Report and Computations by Authors. |
Thus,
the focus of this study is twofold, namely, the estimation of the buoyancy and
elasticity of the tax system of Botswana, and decipher their determinants. The
economy of Botswana has been expanding rapidly and dynamically, as a result, significant
structural changes have taken place with serious implications both for the tax
base and yield, hence buoyancy and elasticity of the tax system. Estimating the
buoyancy and elasticity of the major components of government tax revenue as well
as for the tax system as a whole is useful for showing the extent of the sensitivity
and robustness of the tax system to the changes that take place in the composite
value of GDP (i.e., the proxy tax base). This can provide insights as to whether
or not tax revenue is being maximized relative to the tax base and the appropriate
causes of action for improvements in achievement rates. Tax
buoyancy measures the total response of tax revenue to changes in national income,
while tax elasticity is a measure of the automatic response of revenue to changes
in income, i.e., revenue increases, excluding the effects of discretionary changes
in the tax base, rate and/or structure, [cf. Lewis and Mokgethi (1983); Thac and
Lim (1984); Mtatifikolo (1990); Osoro (1993); Matundu (1995); Ariyo (1997); Masaka
(1997); Kusi (1998); Okello (2001); Mpuchane (2001); Gassama (2004); and Graeser
(2004)]. The approach of this study is to build on Singer (1968) and Osoro (1993),
and extend the theoretical foundation and empirical methodology for estimating
tax elasticity and buoyancy using Botswana time series data to estimate the elasticity
and buoyancy of the Botswana tax system and its major sources (tax categories)
for the period 1982 to 2001 using disaggregated tax bases. Conceptual/Theoretical
Framework While
agreeing with the orthodox literature that tax elasticity and buoyancy are determined
by the tax base, rate and structure, this study goes further to argue that these
determinants of tax revenue, elasticity and buoyancy are themselves determined
both by exogenous and endogenous forces such as the developments in the external
economy, trends in regional cooperation and integration, tax effort and evasion,
and structural shifts in the domestic economy, which are the ultimate determinants
of tax yield and hence elasticity and buoyancy. For example, Ariyo (1997) in studying
the productivity of the Nigerian Tax System adopted disaggregated tax bases around
notable economic events such as the pre- and post-oil boom era, as well as the
impact of Structural Adjustment Program (SAP) on the buoyancy of Nigeria's tax
system and found that these factors significantly affected government tax revenue
and hence tax buoyancy and elasticity. These findings are suggestive of the theoretical
possibility that the tax base is subject to both exogenous and endogenous influences,
which should be accounted. Tax
elasticity and buoyancy in the literature had been estimated or measured by regressing
aggregate tax-based revenue on Gross Domestic Product (GDP)a proxy for the tax
base, and incorporating a dummy variable Singer (1968) or some other proxy to
capture the exogenous influences exerted by tax legislation on the tax net, the
tax rate and/or structure. This study reckons with the insights provided by Ariyo
(1997) to model the historical realities of Botswana accounting for besides discretionary
changes in the tax net, rate and/or structure arising from legislative innovations;
other sources of both exogenous and endogenous influences on the tax base and
yield, and hence on tax elasticity and buoyancy. For example, external developments
in open economies such as Botswana affect the tax base and hence the tax yield
both directly and indirectly. In the emerging order of increasing trade liberalization
and globalization, trade-based tax revenues are likely to be affected. Specifically,
as external trade becomes freer, trade-based tax revenues are likely to dwindle,
if they are not already doing so as exemplified by the behavior of SACU revenue.
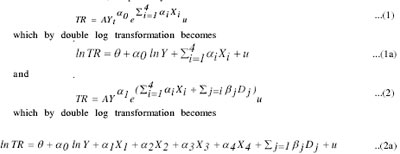
In
general, it is believed that tax revenue will move directly with the level of
economic activity in an economy. As Figure 1 shows, this belief generally holds
for the Botswana tax system. It shows the theoretically expected relationship
between GDP and total revenue except for a deep decline in 2000, which can be
explained by an exogenous shock in the relationship, which strengthens the conviction
of this study's that the factors that influence the base belong in the tax elasticity
and buoyancy functions. 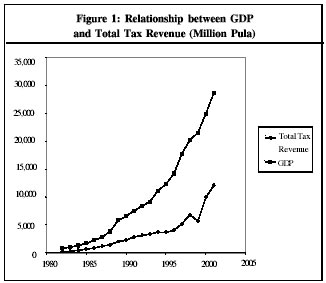 For
Botswana, significant external sources of influence on the tax base and yield,
and hence the tax elasticity and buoyancy are developments in the external economy
and regional cooperation and integration arrangements such as the Southern African
Customs Union (SACU) and Southern African Development Cooperation (SADC) to which
Botswana is a member. As Southern African countries forge regional integration
(SADC), and move increasingly toward free trade, SACU revenues for each individual
country would decline and this is likely to affect tax elasticity and buoyancy.
The effect of this on tax elasticity and buoyancy can be captured by the rate
of regional integration but this is difficult to measure. It may be proxied by
a dummy variable that mirrors correctly when protocols of integration are ratified
and implemented. However, while ratifications might be discernible, observation
might not be that obvious. So in this study, the proportion of SACU revenue (SACUR)
to total revenue is used as proxy.  Figure
2 shows that tax revenue and SACUR would ordinarily move together, but tax revenue
is rising faster than SACUR implying that other factors are in play. Further,
the influence of the behavior of SACUR on total revenue is visible as exemplified
by the correspondence between the dip in SACUR in the mid 1990s and the fall in
total revenue. Given this trend, the proportion of SACUR to tax revenue has been
declining. Equally,
if not more important, is the openness of the Botswana economy. In this study,
the influence of the developments in external sector on the tax base, and hence,
tax buoyancy and elasticity is captured by a measure of the openness of the Botswana
economy defined as {(X+M)/GDP}, X, M, and GDP are, respectively, exports, imports
and gross domestic product. Other
factors that have the potentials of affecting tax elasticity and buoyancy for
any given tax base, rate and structure, are tax effort and compliance. Tax effort
consists of the effectiveness of tax administration and the efficiency of tax
collection. Tax compliance is an increasing function of the willingness of taxpayers
to discharge their tax assessments or tax obligations, even though, an effective
and efficient tax administration can maximize it. Thus, for any given tax base,
rate and structure, the greater the tax effort, the greater will be the tax yield,
and hence, the larger will be the tax elasticity and buoyancy. Tax compliance
in any economy can be measured directly or indirectly by its dualtax evasion.
Since tax compliance and evasion rates are functions of the willingness of taxpayers
to pay their assessments and the capacity of the tax authorities to collect the
taxes for any given level of a tax base the willingness to pay and the ability
to collect will jointly determine the actual yield. Estimates of evasion rates
are used to capture the effects of noncompliance and/or the effectiveness of tax
administration on the tax yield, and hence, the tax elasticity and buoyancy equations.
The proportion of actual tax revenue to potential tax revenue could have been
used as proxy for tax evasion, but because of lack of data, the proportion of
tax arrears to tax revenue is used as proxy. Hence, these rates are proxied by
the ratio of tax arrears to tax revenue. Estimates of evasion rates are used to
capture the effects of noncompliance and/or the effectiveness of tax administration
on the tax yield and hence the tax elasticity and buoyancy equations. In
addition, this study also recognizes the possible influences of endogenous mechanisms
within the domestic economy as it dynamically evolves through time that manifest
in structural changes. A real economy is a living entity that responds to a wide
variety of impulses that externally manifest in structural changes, which affect
the tax base and hence tax elasticity and buoyancy. For the purposes of this study,
structural shift in the Botswana economy is proxied by the ratio of non-mineral
GDP to total GDP and is used to capture the effects of structural shifts on the
tax base, and hence, on tax elasticity and buoyancy. Other possible candidates
as proxies are the ratios of non-mineral tax revenue to mineral tax revenue; non-mineral
tax revenue to total tax revenue and non-mineral tax revenue to GDP. These, however,
mirror more of the effects of structural shifts than the causes whereas the focus
of this study is on the causes. Therefore the proportion of non-mineral GDP to
GDP is chosen over them. 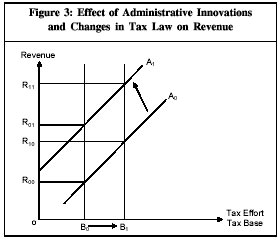 All
else remaining at par, tax revenue is an increasing function of the tax base,
rate and structure, therefore, any factors that determine these will determine
tax revenue, and hence, tax elasticity and tax buoyancy. As argued earlier, for
any given tax base, rate and structure, the actual tax revenue is determined by
the input of tax effort, i.e., the effectiveness and efficiency with which tax
revenue is extracted. Tax rate and structure, however, can be changed by discretionary
policy choices and measures, and to the extent that they are changed they will
affect tax revenue for any given base; and hence, tax elasticity and buoyancy.
During the period under study, there have been considerable changes in tax legislation
coupled with different administrative innovations aimed at achieving increasing
effectiveness and efficiency in tax administration. Figure 3 illustrates how these
innovations will affect the revenue yield. In
Figure 3, tax effort and base are measured on the horizontal axis while tax revenue
is measured on the vertical axis, where B0 and A0 represent
the initial tax base and effort, respectively that combine to yield R00
in revenue. Given this initial tax base, innovations in tax legislation that improve
the tax net, rate and structure and/or the effectiveness and efficiency of tax
administration shifts the tax effort curve up to A1 and tax revenue
increases to R01. Similarly, given the initial level of tax effort,
an increase in the tax base to B1 increases tax revenue but only to
R10. Thus, Figure 3 seems to suggest that improvements in tax effort
might even be more important in mining more revenue out of the same base than
growth in the base without improvements in tax effort, which is intuitive, plausible
and sensible, since irrespective of the size of the tax base, zero tax effort
would yield zero revenue. Of course, improvements in tax effort and growth in
the tax base provide the best of the worlds for growth in tax revenue as these
improvements are self-reinforcing such that revenue increases to R11.
The
theory in sum, therefore, is that the buoyancy and elasticity of the Botswana
tax system are explained by the level of economic activity proxied by GDP, openness
of the Botswana economy, trends in regional cooperation and integration, tax effort
and evasion, and structural shifts in the domestic economy as well as innovations
in tax legislation and/or policy variables that affect the tax base, rate and/or
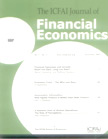
structure. Model
Specification Based
on the above theory, the relationships between tax elasticity and buoyancy and
their determinants are defined, respectively as Where
TR= Tax Revenue; Y = GDP proxy for the level of economic activity; X1 = (X+M)/GDP
proxy for openness variable; X2 = (TA/TR) proxy for tax effort and evasion; X3
= (SACUR/TR) proxy for regional cooperation and integration; X4 = (NMGDP/GDP)
proxy for structural shifts in the economy; Di are dummy variables taking the
value of 1 for each year in which there is a discretionary change in tax policy
during the period 1982-2001, and a value of zero (0) otherwise, ai and bj are
the slope coefficients. In the case of the dummy variables, the summation takes
account of the possibility of multiple tax changes during a specified period.
u is a random error term. X = Exports; M = Imports; TA
= Tax Arrears – proxy for tax effort and evasion; SACUR = SACU Revenue –
proxy for regional cooperation and integration; and NMGDP = Non-mineral GDP.Equation
(2) is the model for estimating the elasticity of a tax system, since it is necessary
to isolate the effect of discretionary changes in tax policy on tax revenue. For
this Singer’s (1968) Dummy Variable Technique (DVT) is adopted. It introduces
a dummy variable into the model to account for the effect of each discretionary
change in the tax rate, bases and structures during the period of study. Thus,
equation (1) is an extension of Osoro (1993) while equation (2) is extension of
Osoro (1993) and Singer (1968) combined. Empirical
Analysis Secondary
data in quarterly time series for the period 1982 to 2001 were obtained from the
Department of Taxes, several issues of the Annual Reports of the Bank of Botswana
(BoB), various issues of Statistical Bulletins published by the Central Statistics
Office (CSO),National Development Plans and Budget speeches published by the Ministry
of Finance and Development Planning (MFDP) for estimating the models. The
data were subjected to diagnostic tests using the general Augmented Dickey-Fuller
tests (ADF), which showed that all the variables in level form at the logarithmic
scale were non-stationary, and also that X1 (proxy for openness) and X3 (proxy
for regional cooperation and integration) were integrated of order two I (2),
while the rest of the variables were integrated of order one, I (1). As a corrective
mechanism, first and second differences were applied. To test for Cointegration,
the Johansen Cointegration Procedure was adopted in order to get insight as the
existence long-run equilibrium relationship between the variables in both the
aggregate and tax categories models. This is accomplished by the specification
of vector error correction models, which allow for a wide range of short dynamics
while the long-run behaviors of the endogenous variables converge to their cointegrating
relationships.These transformations in the data and the error correction modelling
means that equations (1a) and (2a) are modified accordingly for purposes of measuring
the relationships.
Results
of Empirical TestsThe
Aggregate Model
Table
2 reports on the results of estimating the aggregate model of the Botswana tax
system adopted by this study and compares the results with those of estimating
the orthodox model exemplified by Osoro (1993).
Table
2: Estimation Results of the Model Used in this Study |
Thuto-Agiobenebo
Model | Variables | Coefficients | Sum
of Coefficients | t-Statistics | Prob |
C | 0.006739 | 0.006739 | 1.177962 | 0.2433 |
DLTR_1 | 0.690228 | 0.690228 | 8.825414* | 0.000 |
DLY | 1.582698 | - | 3.987343* | 0.0002 |
DLY_1 | 1.423773 | 3.006471 | -3.513350* | 0.0008 |
DLX1 | -0.38916 | - | -4.329683* | 0.0001 |
DLX1_1 | 0.189957 | -0.1992 | 1.851131*** | 0.0689 |
DLX2 | -0.31202 | - | -10.40310* | 0.000 |
DLX2_1 | 0.223442 | -0.08858 | 6.002063* | 0.000 |
DLX3 | -0.36553 | - | -4.379309* | 0.000 |
DLX3_1 | 0.225916 | -0.14021 | 2.520860** | 0.0143 |
DLX4 | 1.053781 | - | 2.129197** | 0.0372 |
DLX4_1 | -0.93901 | 0.114775 | -2.003098** | 0.0495 |
ECT_1 | -0.1131 | -0.1131 | -3.909857* | 0.0002 |
Notes:
The asterisks *, ** and *** denote significance at the 1, 5 and 10% levels |
Sample
period: 1982 to 2001 (Quarterly 80 sample observations) |
Adjusted R2
= 0.9058 | DW=2.0457 |
Diagnostic
tests | Normality
Test: 11.47551 (0.00322) | Breusch-Godfrey
Serial Correlation LM Test: 0.137486 (0.871820) | ARCH
Test: 0.301974 (0.584348) | Ramsey
RESET Test: 1.179350 (0.281761) |
Table
2: Estimation Results of the Model Used in this Study |
| Osoro's
Model | Variables | Co-efficients | t-Statistics | Prob |
C | 0.004803 | 0.482415 | 0.631 |
DLTR_1 | - | - | - |
DLY | 1.00238 | 5.17726*** | 0.000 |
DLY_1 | - | - | - |
DLX1 | - | - | - |
DLX1_1 | - | - | - |
DLX2 | - | - | - |
DLX2_1 | - | - | - |
DLX3 | - | - | - |
DLX3_1 | - | - | - |
DLX4 | - | - | - |
DLX4_1 | - | - | - |
ECT_1 | -0.01293 | -0.20118 | 0.8411 |
Sample
period: 1982 to 2001 | Adjusted
R2 = 0.254257 | DW=0.656713 |
Diagnostic
tests | Normality
JB = 9.004868 [0.0011082] | Breusch-Godfrey
Serial Correlation LM Test: 31.99543 (0.000000) | ARCH
Test: 119.9762 (0.000000) | Ramsey
RESET Test: 21.46693 (0.000016) | ***significance
at 1% level | The
adjusted R2 for the model adopted in this study is 0.9058, implying that about
91% of the variation in tax revenue is explained by the model. The F-statistics
strongly rejects the null hypothesis that the regression coefficients are jointly
equal to zero. This means that all the explanatory variables in the model are
important determinants of tax revenue in Botswana. The Durban Watson (DW) statistic
of 2.0457 indicates that the regression model does not suffer from problems of
autocorrelation. In addition, the results of the Ramsey Reset test show that the
model is correctly specified and the Normality test indicates that errors are
normally distributed.
The
coefficient of the error correction term gives the speed of adjustment of each
variable towards its long run equilibrium value, while the sign of the coefficient
gives the direction of adjustment towards equilibrium. The fact that the sign
of the coefficient is negative implies the variables convergence towards their
long run equilibrium values and relationships. Results from the model used in
this study show that the coefficient is -0.113098 (see Table 2), which is significant
at the 1% or higher level but implies a rather low speed of adjustment; since
only 11% of the previous errors in the tax revenue are corrected for in the current
period. The
results reported in Table 2 show that not only all the variables in the model
have the theoretically expected signs but are also have significant at 10% or
higher levels. The openness, regional cooperation and integration, tax effort
and evasion, and level of economic activity variables are all significant at 5%
level of significance, while the structural shift variable is significant at the
1% or higher level. The lagged value of the dependent variable, TR, incorporates
the delayed and persistent effects of the independent variables on the dependent
variable and is therefore included to capture the policy lags in the variables.
The coefficient of this variable is positive and highly significant at the 1%
or higher level. Thus, all the variables are significant determinants of total
tax revenue, and hence, tax elasticity and buoyancy in Botswana. The
sign of the openness variable deserves some elaboration. The sum of the coefficients
of the current and lagged values of this variable is negative. This means that
on average the openness of the Botswana economy is tax revenue depleting and will
adversely affect both tax elasticity and buoyancy. Theoretically speaking, the
sign of this variable is indeterminate. Exports are expected to have positive
effects on the level of economic activity and hence on the tax base, but imports
can go either direction depending on the prevailing tax policies and regimes.
Further, the Botswana economy is heavily dependent on imports and more so for
consumption of goods, which represent serious leakages out of the system that
constrict the tax base. In addition, the evidence, may in part capturing the indirect
adverse effects of increasing regional cooperation and integration on SACU revenue
and its higher implications for tax revenue in Botswana. In sum, the results show
that the negative effects of imports on the base, and hence, tax revenue outweigh
the positive effects of exports. Indeed,
the results of the model adopted in this study are rich in insights. For example,
the effects of the institutional mechanism governing the administration and disbursement
of SACU revenue to member countries are discernible. Since revenue disbursements
are not contemporaneous, the withholding of current SACU revenue collections is
tax revenue depleting for member countries including Botswana, which is offset
when the revenue is finally received. Thus, the coefficients of X3 in the current
period is negative while that of the lagged valued is positive. On average, however,
there is a negative relationship between the proportion of SACU revenue to GDP
and total tax revenue over the period of study implying that the negative effects
outweigh beneficial effects of SACU. This is in consistent with the expected outcome
(hypothesis) that as Southern African countries forge regional integration and
move increasingly toward freer trade, SACU revenues for each individual country
would decline and thus lead to a decline in total tax revenue. In addition, the
economy of Botswana is open and is therefore responsive to trade liberalization
and globalization trends. These reduce imports and exports duties as sources of
government revenue, thus, for the same tax base, with increasing openness, less
tax revenue will be realized as shown by the overall negative coefficient (-0.1992)
of X1. This result is different from the one from a study by Mpuchane (2001),
which reported that the openness of the Botswana economy is insignificant and
does not have any impact on the performance of the tax system of Botswana. Similarly,
while tax evasion is revenue depleting, efforts to collect tax in arrears partially
offsets its effects on tax revenue. Thus, the coefficient of the current value
of tax evasion is negative; the coefficient of its lagged value is positive. But
again, the collection of tax arrears notwithstanding, tax evasion is revenue depleting
as the sum of the coefficients is negative. It follows that tax administration
and follow up problems affect tax yield, and hence elasticity and buoyancy negatively.
It is also evident from the results that while structural shifts (innovations)
impact positively on tax revenue, and hence, tax elasticity and buoyancy, structural
rigidities have adverse effects given that the coefficient of the current value
of the structural shift variable X4 is positive and that of the lagged value is
negative. Happily, the positive effects outweigh the negative effects since the
sum of the coefficients is positive. Returning
to the comparison with the results of Osoro (1993), it is self-evident that the
orthodox model is inferior and seriously miss-specified. The model clearly violates
the important assumptions of the classical linear model that there is no autocorrelation
among the disturbance terms ui, and that the regression model is correctly specified.
Hence this study extends the theoretical, methodological and empirical developments
in the estimation of tax elasticity and buoyancy. Tax
Buoyancy and Elasticity Table
3 reports on the results of estimating the buoyancy of the Botswana tax system
by aggregate and categories. The buoyancy coefficient of the total tax system
is 1.982, which is significance at the 5% level indicating a responsive tax system.
The regression results indicate that GDP, tax effort and evasion explain about
94% of variations in tax revenue.
Table
3: Tax Buoyancy by Aggregate and Categories | Categories | Buoyancy
Coefficient | t-statistic | R2 | DW-Statistic |
Total
Tax Revenue | 1.982 | 7.795 | 0.948 | 1.91 |
Mineral
Revenue | 2.274 | 9.534 | 0.682 | 1.69 |
Customs
and Excise Duties | 0.74 | 2.099 | 0.558 | 1.43 |
Non-Mineral
Income Tax | 1.504 | 4.443 | 0.676 | 1.77 |
Mineral
revenue is buoyant with a coefficient of 2.274, which is significant at the 1%
level, showing that it is an important determinant of tax revenue in Botswana.
About 68% of the behavior of mineral revenue is explained by mining GDP and the
openness of the economy. The buoyancy coefficient of customs and excise duties
is below unity (0.740) implies that customs and excise duties are not buoyant.
This can be attributed to the influence of regional integration, whereby movement
toward freer trade, causes a decline in SACU revenues for Botswana. Also, the
industrial base of the Botswana economy is very narrow and its contribution to
GDP is even on the decline. The t-statistic (2.099) is lower than the critical
value, this leads us to the decision to accept the null hypothesis and conclude
that customs and excise duties are not buoyant. A
buoyancy coefficient of 1.504 means that non-mineral income taxes are buoyant
as expected and is significant at the 10% level. The R2 shows that 68% of the
variation in non-mineral income tax is explained by exports, imports, manufacturing
output and structural shifts in the economy. Table
4 reports on the results of estimating the elasticity of the Botswana tax system
by aggregate and categories. A measurement of the tax elasticity requires that
data on tax revenues be adjusted to eliminate the effects of discretionary tax
measures. Over the study period however, no changes in tax legislation known to
these s took place for mineral revenue and customs and excise duties. As
a result, their elasticity coefficients are assumed to be the same with the values
of their buoyancy coefficients. Thus, from Table 3, the customs and excise duties
are inelastic with a coefficient below unity (0.740), while mineral revenue is
highly elastic with a coefficient above unity (2.274).
Table
4: Tax Elasticity by Aggregate and Categories | Categories | Buoyancy
Coefficient | t-statistic | R2 | DW-Statistic |
Total
tax Revenue | 1.56 | 8.17 | 0.973 | 1.91 |
Mineral
revenue | 1.385 | 4.96 | 0.692 | 1.83 |
With
an elasticity coefficient of about 1.56, which is significant at the 1% level,
the Botswana tax system is income elastic. An R2 of 0.973 indicates that the tax
base adequately explains variation in the tax revenue. The
elasticity coefficient of Non-mineral income tax is 1.385, which is significant
at the 5% level, indicating that it is elastic. The R2 indicates that the tax
base explained about 69% of the variation in non-mineral income tax. As
shown in Tables 3 and 4, the tax system as a whole had a buoyancy of 1.982, which
is higher compared with an elasticity of 1.56. This difference indicates that
discretionary changes improved the revenue performance of the tax system. Performance
of the tax system depends not only on the amount collected, but also on several
other factors, such as: tax effort, effectiveness and efficiency of tax administration,
tax evasion and avoidance, compliance burden, transparency and accountability,
efficiency and allocation effects of taxes in the economy. Others include lack
of taxpayer education, cultural variables, operational inadequacies of the tax
administration in Botswana, inadequacies and loopholes in the law among others.
These additional variables that are not part of the formal modelling are identified
by key informants who responded to a structured questionnaire that solicited the
perceptions of key stakeholders on the performance of the Botswana tax system. Tax
effort by the Botswana Government Government
Tax Effort is Defined as: 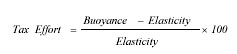
That
is, it computed as the percentage difference between the size of buoyancy and
elasticity coefficient relative to the elasticity coefficient of the total tax
system. This computation is intended to test whether or not the Government of
Botswana has exerted enough effort to realize its tax potential. The computation
of the tax effort shows a government tax effort is only 27%, which is far below
its potential. Thac and Lim (1984) obtained a tax effort coefficient of 40% for
Papua New Guinea. Summary
and Conclusion This
study estimated the elasticity and buoyancy of the Botswana tax system along with
those of its major sources or tax categories for the period 1982 to 2001 using
quarterly data, and also tested some key novel propositions that tax elasticities
and buoyancies are affected by developments in the international economy proxied
by the degree of openness variable, trends in regional cooperation and integration
proxied by the proportion of SACU revenue in total revenue of Botswana which is
affected by the development of SADC and structural shifts as the economy of Botswana
evolves dynamically through time proxied by non-mining GDP to GDP. The study used
a Vector Error Correction Model (VECM) to estimate the relationship. The innovations
introduced into the tax elasticity and buoyancy estimation theory and methodology
add to the richness of the results available to address the composite question
of how elastic and buoyant is the Botswana tax system and the individual taxes
and what their determinants are. The econometric results obtained in this study
show that for the open economy, developments in the international economy, trends
in regional cooperation and integration and structural shifts are significant
determinants of the tax bases and hence tax elasticities and their buoyancies.
Further, for any given tax base, tax evasion depletes the tax yield (receipts),
and hence, tax elasticities and their buoyancies. Policy
Implications Although
the results from this study showed that the overall tax system for the period
1982-2001 is buoyant and elastic, buoyancy coefficients and elasticity indexes
for the tax sources relative to their respective tax bases are not sufficiently
high. Government should therefore undertake more discretionary measures in order
to improve the revenue performance of the Botswana tax system, and more importantly,
step up efforts to diversify the economy. The evidence is strong that Botswana
can extract significantly more revenue from its tax base if only it can step up
tax effort and minimize tax evasion and avoidance. Although
the revenues from SACU account for a significant amount of government revenue,
they have been declining over the years due to increasing free trade amongmember
countries, the Government of Botswana therefore faces the challenge of diversifying
its revenue sources by identifying new and viable sources of revenue to sustain
its development efforts. In this regard, government introduced Value Added Tax
(VAT) in 2002, which is still at experimental stages. The Government therefore
has to move quickly to improve the general understanding of VAT and how it can
best be operated in the VATED companies, as well as increase the transparency
of the system and the accountability of the operators. To achieve these, government
must move to minimize the compliance burden of the operators, in particular, small
and medium sized operators. High compliance costs and a complicated tax system
could cause disincentives among tax payers and lead to evasion, therefore, the
compliance burden for taxpayers, particularly self employed individuals and small
businesses should be investigated, mapped, measured and minimized. Also, initiatives
should be taken to make the tax system as less complicated as possible. In addition,
there is a vast potential to expand the VAT net and government should explore
and exploit this vigorously. In
order to reduce the cost of tax administration, reforms aimed at improving the
effectiveness and efficiency of tax assessment and the collection of outstanding
taxes need to be undertaken. The cost of tax administration in Botswana is too
high, the acceptable norm is said to be between 1 to 2%, in Botswana it is 42%. Limitations
of the Study and Recommendations for Further Study Botswana
like most developing countries is faced with the problem of lack of well-documented,
up-to-date database. As a result, data for some variables could not be attained.
The data generated is from 1982-2001, due to inconsistencies; data for more recent
years was not used and this has affected the currentness of the study. For example,
the proportion of actual tax revenue to potential tax revenue could have been
used as proxy for tax evasion, but because of lack of data, the proportion of
tax arrears to tax revenue was used as proxy. So, as more and better data become
available, the model can be tested again. The
model used in this study did not capture the effects of very important macroeconomic
policies that affect tax revenue. According to Tanzi (1991), there are three main
macroeconomic policies that may affect tax revenue negatively are; overvaluation
of the national currency, import substitution and trade restrictions. However,
import substitution and trade restrictions cause elimination by substitution,
so it cannot be taken for granted that they necessarily reduce tax revenues. The
actual outcome depends on the relative tax yield of protected domestic activities
and trade duties. After all, the former will yield triple sources of tax revenue,
namely; income tax, company tax and excise duties. Therefore, for further research,
these macroeconomic policies can be incorporated into the elasticity and buoyancy
equations to analyze their effect on the performance of the Botswana tax system.
Although
this study estimated tax effort by the Botswana government, a detailed investigation
of policies that make the tax system ineffective and inefficient (and vice versa)
should be carried out to decipher their implications. Furthermore, further research
on how controls for both changes in tax rates and rules affect government’s
efforts to maximize tax revenue should be undertaken. Another
possible area for future research is the effect of the introduction of broad-based
Value Added Tax (VAT) to replace sales tax in 2002, on total tax revenue, and
consequently tax elasticity and buoyancy.In 2002, SACU reviewed and changed exogenously
the revenue sharing formula among its members, the effects of this on SACU revenue
could not be accounted for by this study because of the use of quarterly data
which cut the period of study to 2001, which automatically excluded the period
of the revenue formula innovation from the period of this study. So, future studies
on the buoyancy and elasticity of the Botswana tax system should try to account
for the possible effects of the change in revenue formula, since it exemplifies
policy innovation or exogenous change in tax legislation and/or administration. References 1.
Ariyo A (1997), “Productivity of the Nigerian Tax System”, Africa Economic
Research Consortium, Research Paper, No. 67. 2.
Bank of Botswana (Various Issues), Annual Reports, Gaborone, Botswana. 3.
Budget Speeches (Various Issues), Ministry of Finance and Development Planning,
Gaborone, Botswana. 4.
Central Statistics Office (Various Issues), Statistical Bulletins, Gaborone, Botswana. 5.
Department of Taxes (1982-2002), Commissioner’s Reports, Gaborone, Botswana.
6.Gassama H N (2004), Elasticity and Buoyancy of the Tax System in Liberia, Unpublished
MA Dissertation Submitted to the University of Botswana, Gaborone. 7.
Greaser (2004), “Determination of Elasticities of Revenue Growth to Changes
in GDP", US treasury, Office of Technical Assistance. 8.
Kusi K N (1998), “Tax Reform and Revenue Productivity in Ghana”, African
Economic Research Consortium, Research Paper No. 74. 9.
Lewis S R and Mokgethi D N (1983); Botswana’s Economy Since Independence,
(Tata McGraw-Hill Publishing Company Limited, New Delhi) 10.
Masaka G N (1997), The Determinants of Tax Revenue in Botswana, Unpublished BA
Dissertation Submitted to the University of Botswana, Gaborone. 11.
Matundu 0 (1995), Evaluation of the revenue performance of the Namibian Tax System,
(unpublished MA Dissertation submitted to the University of Botswana, Gaborone) 12.
Mpuchane (2001), The Elasticity of the Tax System of Botswana, Unpublished BA
Dissertation Submitted to the University of Botswana, Gaborone. 13.
Mtatifikolo F P (1990), “An Economic Analysis of Tanzania’s Tax Performance
Experiences Since the 1973 Tax Act”, Eastern Africa Economic Review. 14.
National Development Plans (Various Issues), Ministry of Finance and Development
Planning, Gaborone, Botswana. 15.
Okello A K (2001), “An Analysis of Excise Taxation in Kenya”, An African
Economic Policy, Paper No. 73. 16.
Osoro (1993), “Revenue Productivity of the Tax System in Tanzania”,
Journal of African Economics, No.3. 17.
Singer N M (1968), “The Use of Dummy Variables in Establishing the Income
Elasticity of State Income Tax Revenues”, National Tax Journal, Vol. 21,
June, pp. 200-04. 18.
Tanzi V (1991), “Public Finance in Developing Countries”, Edward Elgar
Publishing Limited, United Kingdom. 19.
Thac D C and Lim D (1984), “Papua New Guinea’s Tax Performance, 1965-1997”,
World Development, Vol. 12, No. 4, pp. 451-459. Reference
# 42J-2006-12-03-01. |